
Analysis with the help of the statistical program Minitab
Why Minitab? Because it contains ready-made statistical analysis and quality control procedures, it provides clear graphics that are fully customizable.
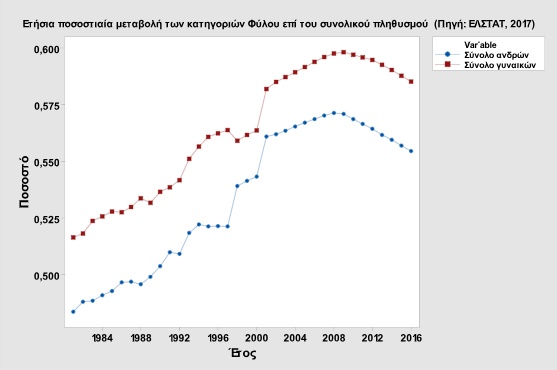
Following is a sample of Minitab's capabilities with data on the annual percentage rate (number of persons to total population) of employment for the period from 1981 to 2016 according to data from ΕΛΣΤΑΤ
Visual examination of the percentage of the population by gender category shows higher percentages for the category of women (more women) and a similar trend after 2000. There is also a constant difference of 2.5% between the two categories.
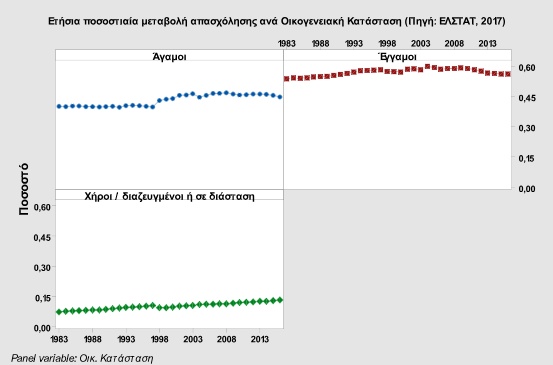
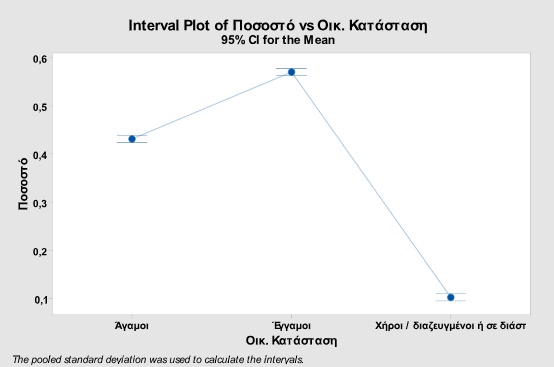
Examining the annual percentage change in employment by marital status shows that people who are divorced or widowed or separated show little growth differentiating their course after 2007-2008 from the similar course shown by married and single people.
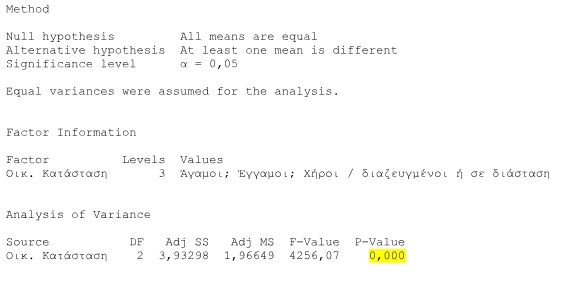
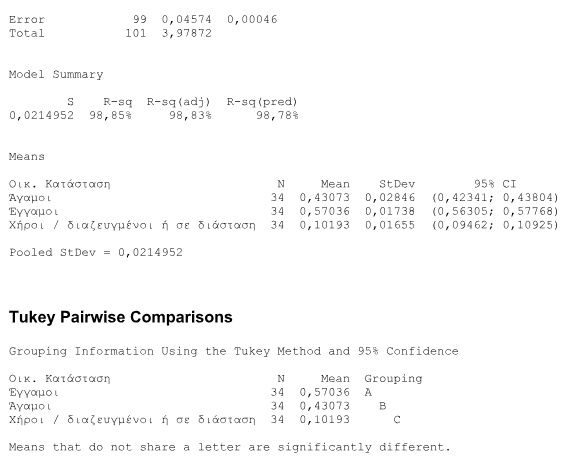
The investigation of the importance of marital status as a factor with the help of the analysis of variance (One Way ANOVA) shows that this factor is statistically significant at a 5% significance level (but also at a 1% significance) since (F(2) .99)=4256.07, Sig. < .001). The further examination (Tukey's post hoc analysis) shows that there are statistically significant differences between the categories of the examined factor and that the highest employment rates are shown in the category of married people.
One-way ANOVA: Percentage versus Οικ. Κατάσταση
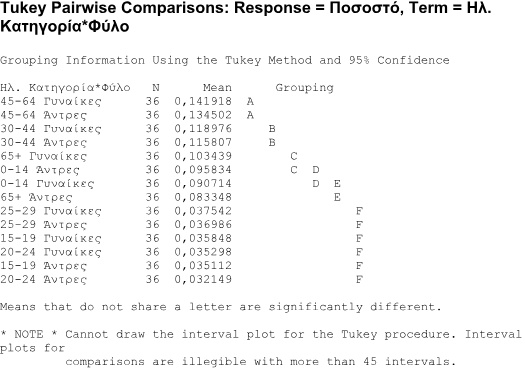
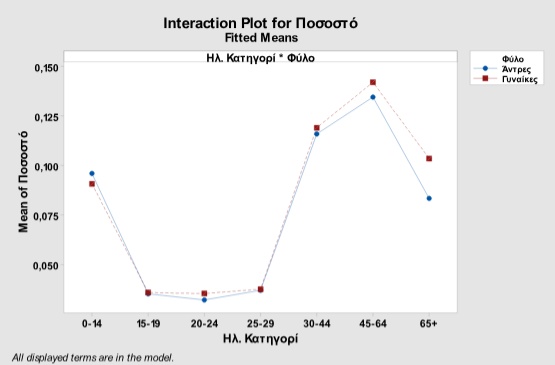
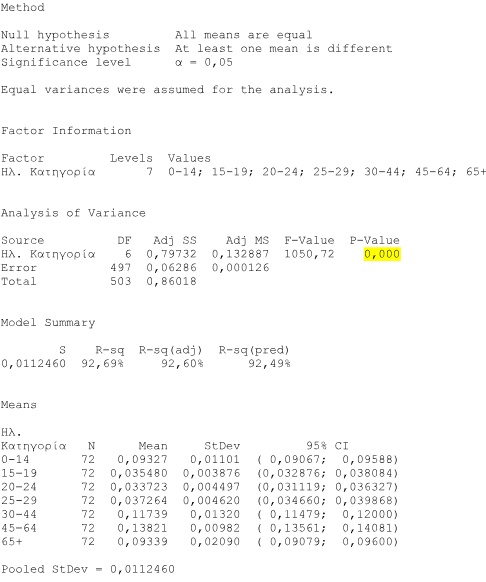
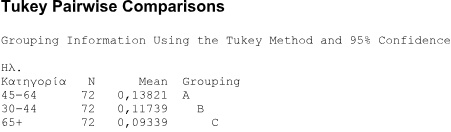
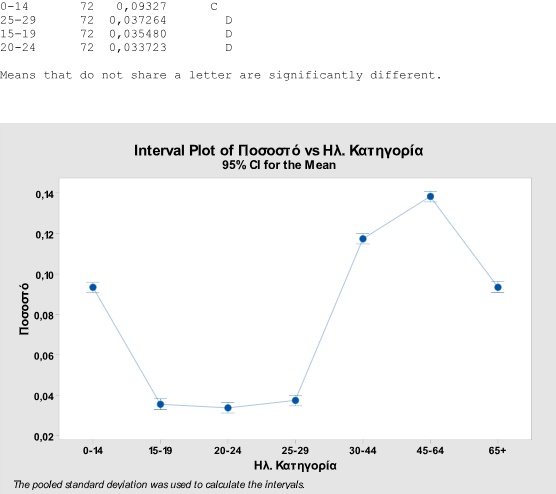
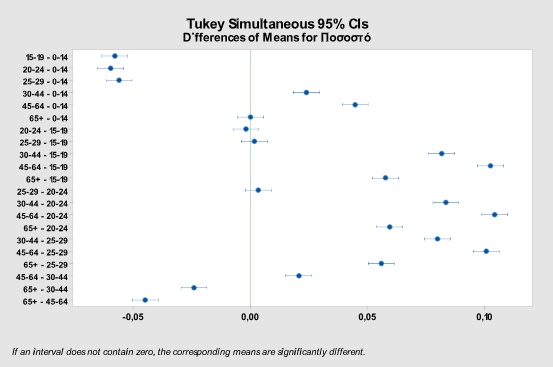
The investigation of the employment rates in relation to the gender and age group of the population showed that visually the changes show a similar course between men and women as well as that there is a significant increase in the employment rates for the population older than 45 years.
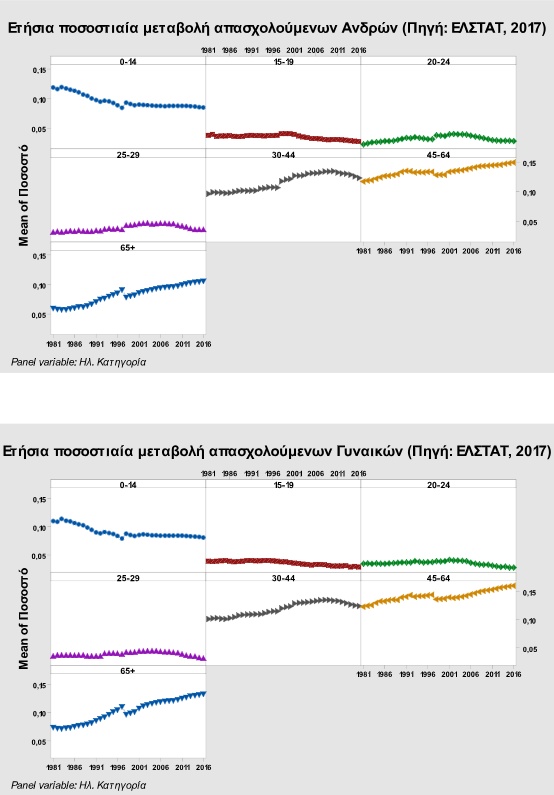
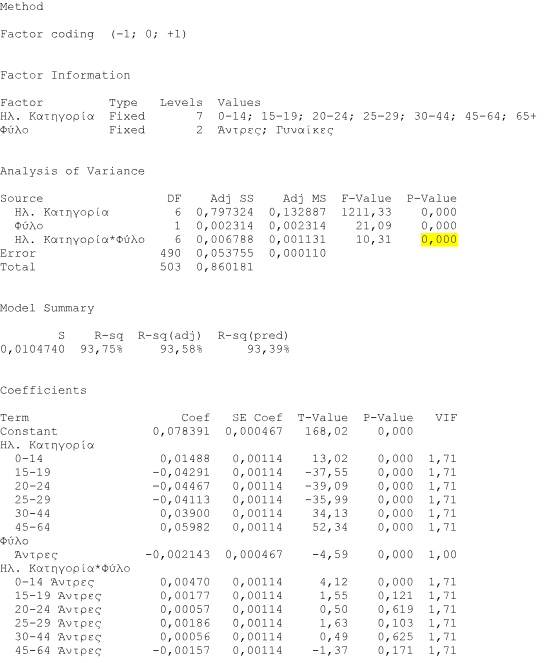
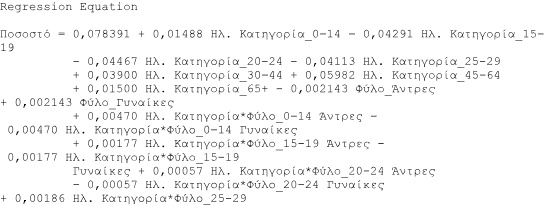
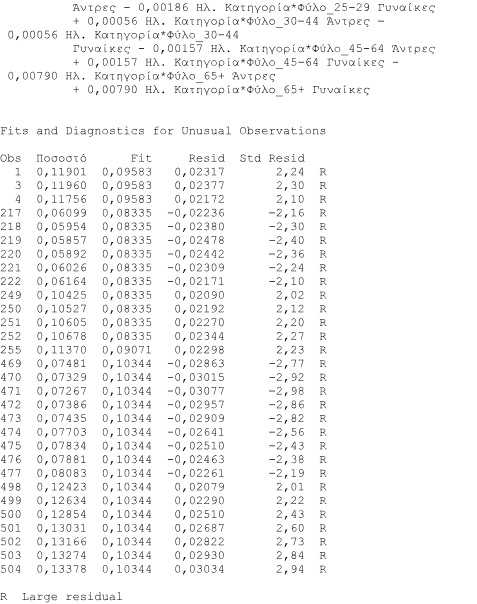
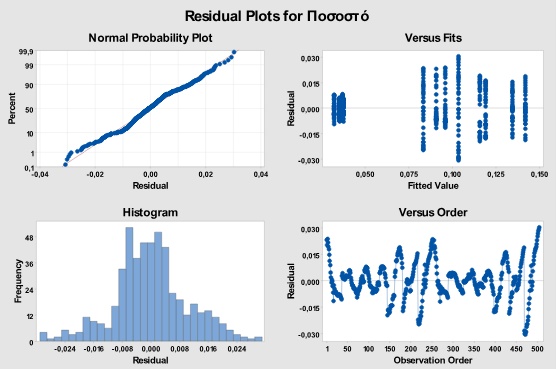
The examination of the factor age category and gender in relation to employment rates showed that the factor age category is statistically significant (F(6,497)=4256.07, Sig. < 0.001) with a statistically significant difference between the ages 45-64 and 30 -44 for which the highest percentages are presented
One-way ANOVA: Percentage versus Age. Categories
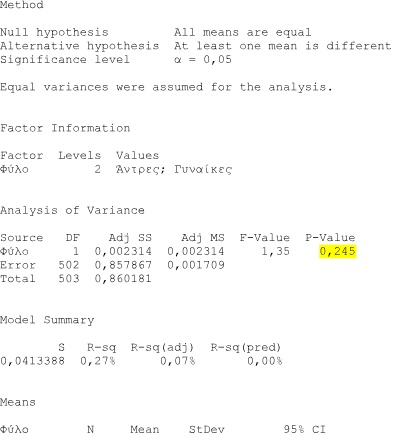
The gender factor was not found to be statistically significant, showing that there is no difference in employment rates between men and women.
One-way ANOVA: Percentage versus Gender
The examination of the interactions between the age categories and the gender factor showed that the interaction between it was found to be statistically significant which occurs during the transition from the age category 0-14 to 15-19 between men and women for which men present slightly higher value than women in contrast to all the other examined age categories in which women have a higher percentage.
General Linear Model: Percentage versus Age. Categories; Gender