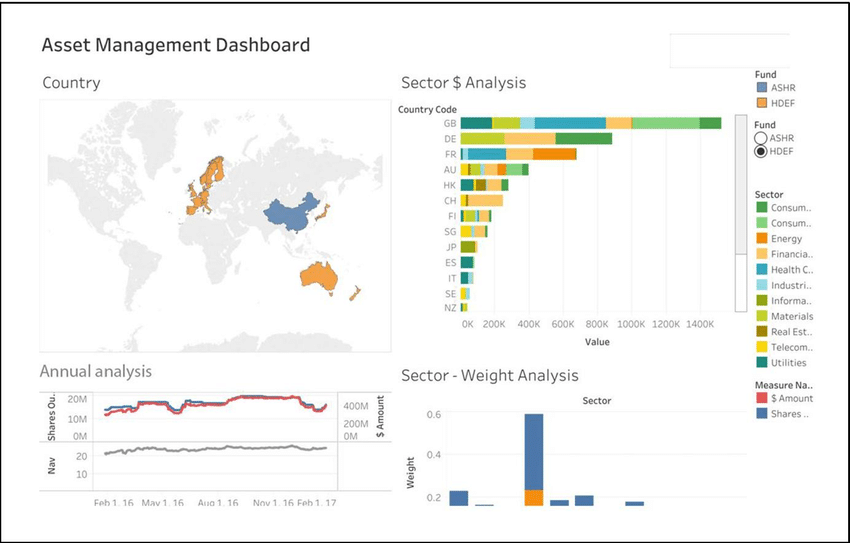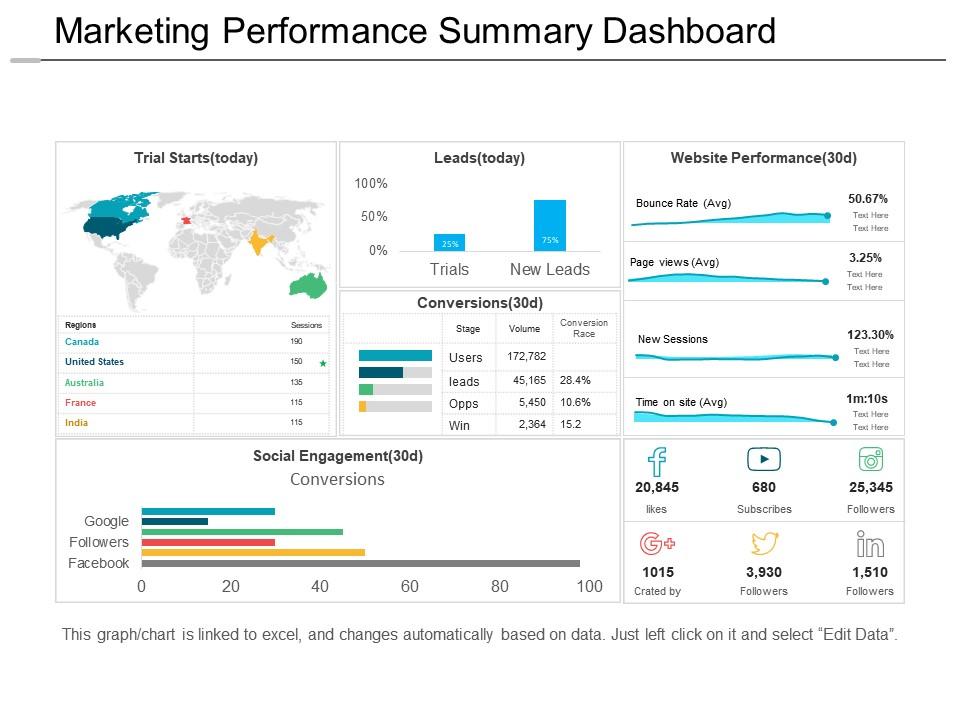
Tableau was founded in 2003 as the result of a computer science program at Stanford that aimed to improve the flow of analysis and make data more accessible to people through visualization. Co-founders Chris Stolte, Pat Hanrahan and Christian Chabot developed and patented Tableau's core technology, VizQL, which expresses data visually by translating drag-and-drop actions into data queries through an intuitive interface. Since its inception it has been a constant evolution and development, developing solutions to work with data in order to increase the speed and power of the program. This includes making machine learning, statistics, natural language and intelligent data preparation more useful for augmenting human creativity in analysis. In addition to being a complete, integrated analytics platform, tableaux helps operators develop and scale a data-driven culture that drives resilience and value through powerful results. The best features of Tableau software are
- Data Blending
- Real time analysis
- Data coordination

A key advantage of Tableau software is that it requires no technical or programming skills of any kind to operate. The tool has gathered the interest of people from all walks of life, such as business, researchers, different industries, etc.
 Tableu main use are:
- Business Intelligence
- Data visualization
- Data coordination
- Data Blending
- Real time data analysis
- Query translation to visualization
- Big Data
- Queries without code writing
- To manage large volume metadata
Today, organizations—from nonprofits to global enterprises, and across all industries and departments—are empowering their people with Tableau to drive change with data.

