

NVivo is the leading software for qualitative data analysis.
Qualitative researchers describe, evaluate, and interpret social phenomena. They analyze data from interviews, surveys, field notes, websites, and journal articles, and work in fields ranging from social science and education to healthcare and business. NVivo allows them to organize, analyze, and visualize their data, finding patterns within it.
WHY USE NVIVO?
- Organize and analyze text, audio, video, or image data through the qualitative coding process.
- Ability to play audio and video files so interviews can be transcribed into NVivo.
- Import references from EndNote, Mendeley, Zotero, Citavi or other bibliography management software.
- Perform simple text analysis queries (such as text search or word frequencies) on text data in English, French, German, Spanish, Portuguese, Japanese, and Simplified Chinese.
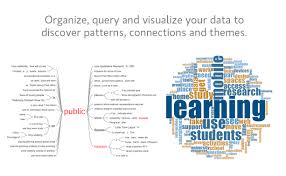
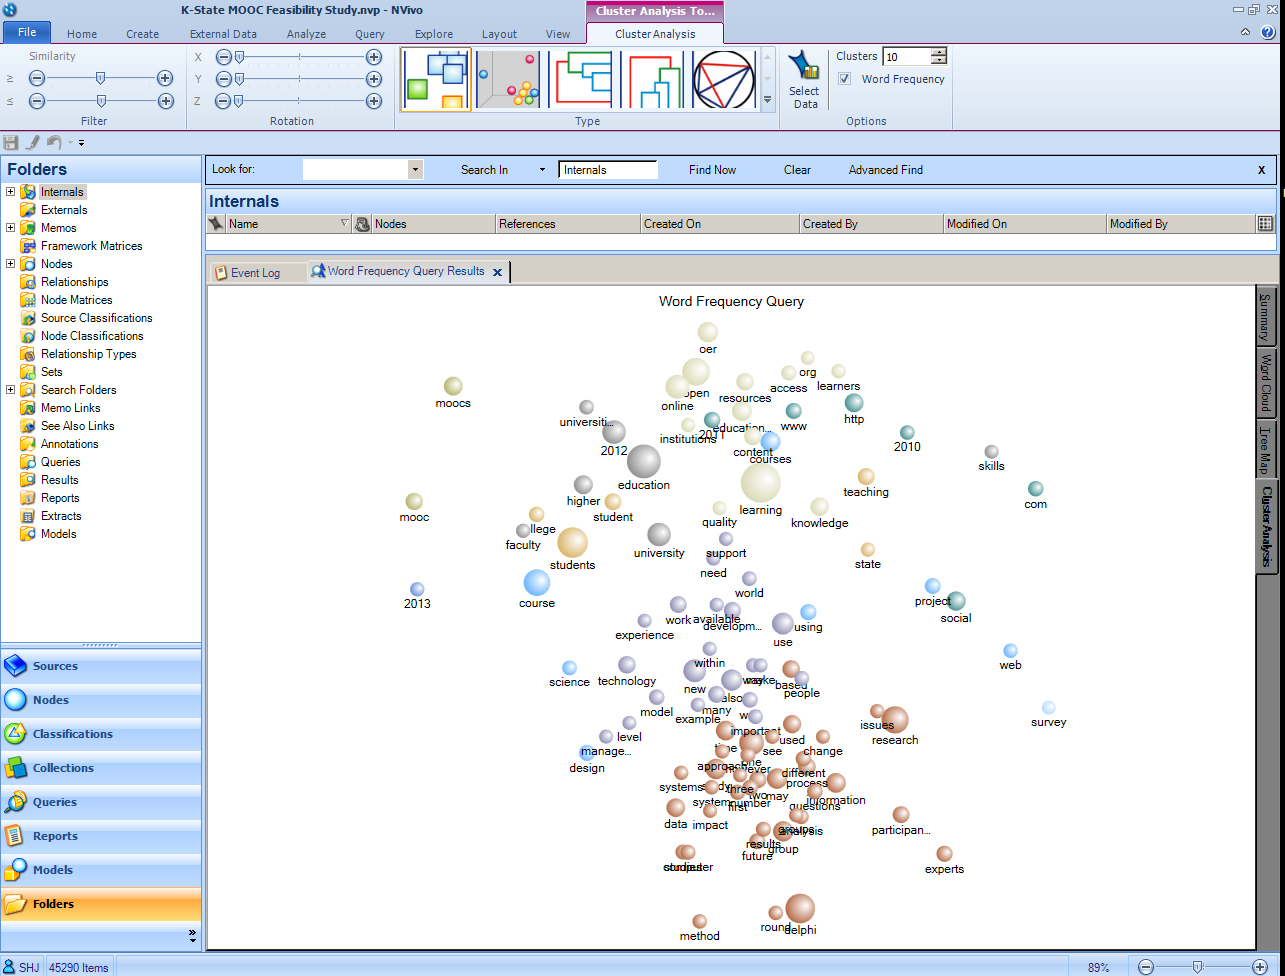
Miles and Huberman’s approach to qualitative data analysis follows three basic steps, including data reduction, data visualization, and inference and validation. Data reduction includes what we have discussed so far about preparing raw data for analysis using nodes (codes), cases, classifications, and linking cases and coded data to learn what themes emerge from the data analysis. In addition, NVivo has many features in its toolset that facilitate the process of finding relationships between pieces of data as themes begin to emerge. These tools include the ability to query the data to search for codes or word usage, develop a framework matrix, and visualize relationships between coded data through mind maps, concept maps, and project maps.
Graphs with NVivo
In addition to quantifying your qualitative data, BasisPap can prepare graphs such as word clouds and cluster analysis that allow the appearance of possible patterns among interviewees' responses.